PulsePunch Boxing Components
In my previous blog post, I talked about the rough prototyping of PulsePunch, an analytical suite for boxing workouts to measure cardiovascular health with relation to boxing movements. I set out the goal with collecting data in a more visually appealing and thorough way. I want to break this post down in the following three ways.
- Data Collection Evolved
- UI Fundamentals
- Audience Reception
Data Collection Evolved
We talked last time about the lackluster sampling rate from the sensor. To remedy this, I changed the delta sampling feature for the accelerometer to 52 hz a second.
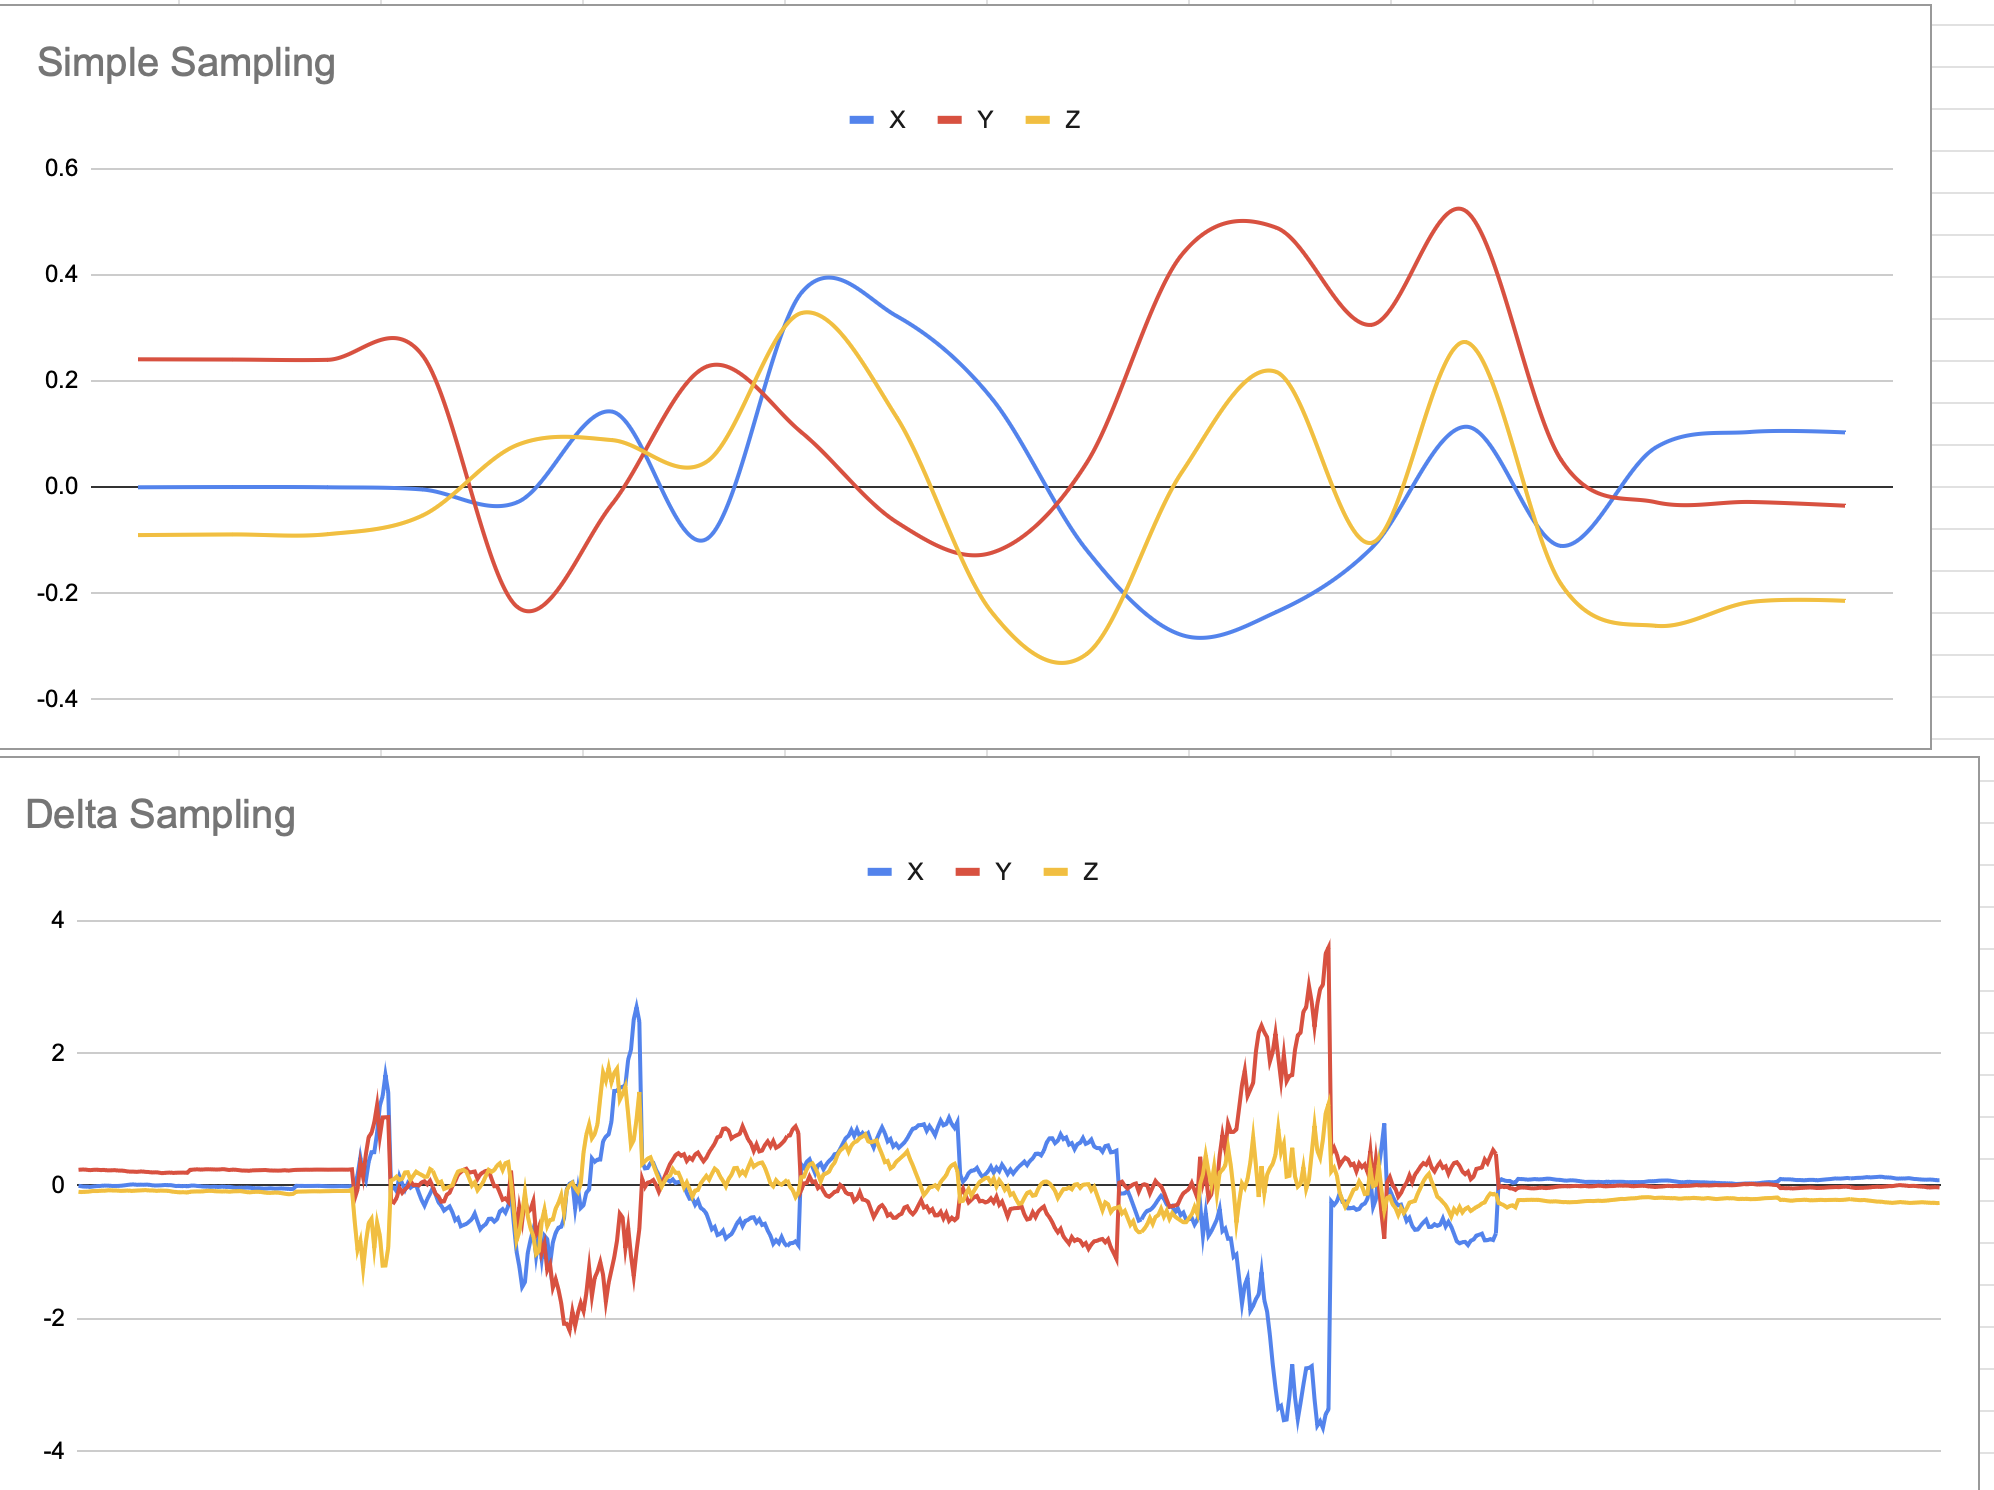
This is a classic sampling problem many engineers will run into if they’re not familiar with signal processing. With this change we’re no longer missing every other word spoken - we’re now capturing every part of a punch thrown, the extension and the retraction of the punch.
This simple change to the data improves the fidelity of the models I’ll be working to correlate features about a punch. So now we can ask questions about what kind of punch was thrown - for example a jab, a hook, or an uppercut, how quickly the energy was created to throw the type of punch, and the power generated by the punch.
This is where the sweet science meets data science.
UI Fundamentals
I compress all of the graphical elements into a tiny collapsible view component I call
TinyView.
I added the blue and green borders to show how two components are sharing the same space. In practice, there is no border, it’s simply for demonstration here. Let’s talk source code declaration:
<TinyView targetColor="blue" targetTitle="Heart Tab" targetSize="large"
viewA={} viewB={}/>
viewA and viewB are whatever components we want to drop into our TinyView. This way we can focus on visuals and not worry about widgets getting in the way of one another. If we don’t care about a particular visual, just tap the button and it is collapsed out of view.
Two other visuals I am most proud of include:
- Zone 5
- Zone 4
- Zone 3
- Zone 2
- Zone 1
140 BPM

Audience Reception
It has been a wild ride just showing off these components alone. I have worked with a three different kinds of people. The general gym population, boxers, and those training to be boxers. The inputs and modifications they have provided have been incredibly helpful.
First, let’s talk heart rate zone training.
| Zone | HR Max Percentage |
|---|---|
| Zone 5 (anaerobic) | 90% HR max and above |
| Zone 4 (lactate threshold) | 85%-88% |
| Zone 3 (tempo) | 80%-85% |
| Zone 2 (aerobic/base) | 65%-75% |
| Zone 1 (recovery/easy) | 55%-65% |
The purpose of this form of training is finding how hard the heart is working. Not all hearts are built the same, so to find the maximum heart rate I used Gellish’s forumla:
HRMax = 206.9 - (0.67 x ageInput)
Now, I’ll admit that finding the max heart rate is a highly contested topic in the fitness and medical journal circles. However, this is purely an input we can modify at any given time. To make things even worse, we’re deriving heart rate from a PPG signal using the sensor. Remember though, it’s a visual, it’s not necessarily a prescription or replacement for a regular EKG. To put it in perspective…
“A map is not the territory it represents, but, if correct, it has a similar structure to the territory, which accounts for its usefulness. Alfred Korzybsk”
In our case, it’s a great visual indicator for how hard an athlete is working. If you talk to a professional athlete, they’ll know how hard they’re working.
Generally, people at all cardio levels were interested in getting to Zone 4 or 5 and staying there. Being able to stay in those zones and go back down to their recovery zone is what matters. Boxers know this, it’s why the breathing between rounds is so important.
We can also identify over-training with this visual and the data itself. If the heart rate doesn’t come down, we know the boxer is overtraining and not at peak performance. The resting heart rate might be even a little higher too. This sort of diminishing returns just goes to show that rest is just as important as the physical training itself.
Let’s get building some simple analytics next!